AI Intelligence — Opportunities Analytics Overview
The Opportunities section in Call Intelligence provides a complete view of all scheduling opportunities generated from phone calls. It helps practices understand how many potential appointments were created, how many were won, how many remain open, and why some were lost. Use this guide to understand every KPI and chart shown in the Opportunities dashboard.
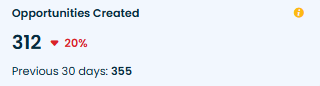
Opportunities Created
What it means
The total number of scheduling opportunities generated during the selected time period. An opportunity is created when a patient shows intent to schedule an appointment, regardless of whether the appointment is ultimately booked or not.
This is the starting point of the scheduling funnel. It shows true demand for appointments and helps measure how effectively the practice converts scheduling intent into booked visits.
How practices use it
-
Track total potential scheduling volume
-
Identify whether marketing and inbound efforts are generating appointment interest
-
Compare opportunity creation across months or seasons
Example
If 312 opportunities were created this month, 312 callers showed intent to schedule but had not yet booked at the time of the call.
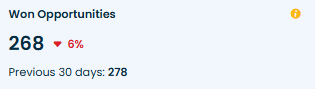
Won Opportunities
What it means
The total number of opportunities that were successfully converted into booked appointments.
Why it matters
This shows actual scheduling success and how efficiently the front desk converts interest into appointments.
How practices use it
-
Evaluate overall booking performance
-
Measure the impact of coaching and scripting
-
Set targets for weekly/monthly scheduling wins
Example
If 268 out of 312 opportunities were won, the practice successfully booked 268 appointments from interested callers.
Opportunity Win Rate

What it means
The percentage of total opportunities that were converted into booked appointments.
Why it matters
This is the core performance metric for scheduling effectiveness. A high win rate indicates strong handling of appointment inquiries, while a low win rate signals training, process, or staffing gaps.
How practices use it
-
Monitor conversion trends over time
-
Evaluate performance after new scripts or workflow updates
-
Benchmark against internal expectations (e.g., target 70%+ win rate)
Example
If 268 of 312 opportunities were booked, the Opportunity Win Rate is 86%.
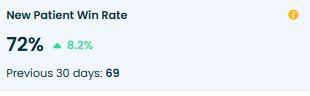
New Patient Win Rate
What it means
The percentage of new patient scheduling opportunities that were successfully converted to appointments.
Why it matters
New patient opportunities directly impact practice growth. This metric reveals how well the team converts high-value, first-time callers.
How practices use it
-
Evaluate onboarding and first-contact handling
-
Measure the success of marketing-generated leads
-
Identify training needs specific to new patient conversations
Example
If 51 of 70 new patient opportunities were booked, the New Patient Win Rate is 72%.
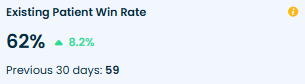
Existing Patient Win Rate
What it means
The percentage of existing patient scheduling opportunities that resulted in booked appointments.
Why it matters
A low number here often indicates process gaps—existing patients should be the easiest to convert.
How practices use it
-
Detect follow-up bottlenecks
-
Evaluate the quality of recall, recare, and reschedule workflows
-
Monitor patient loyalty and experience
Example
If 53 of 86 opportunities from existing patients were booked, the Existing Patient Win Rate is 62%.
All Open Opportunities
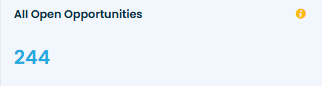
What it means
All scheduling opportunities that remain open and still require follow-up.
Why it matters
Open opportunities represent active scheduling potential. A high number indicates missed follow-up or process delays.
How practices use it
-
Assign staff to follow up daily or weekly
-
Prevent lost revenue due to long delays
-
Monitor backlog size and response time
Example
If 244 opportunities remain open, these 244 patients have shown interest but have not yet booked.
All New Patient Open Opportunities
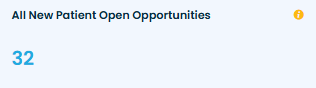
What it means
The number of open opportunities specifically for new patients.
Why it matters
Open new-patient opportunities represent high-value leads. Quick follow-up is essential to avoid losing them to competitors.
How practices use it
-
Prioritize outreach to new patients first
-
Set tighter SLAs (same-day or next-day callbacks)
-
Track marketing lead handling effectiveness
Example
If 32 new-patient opportunities are open, these 32 callers are not yet booked and may still convert if followed up quickly.
All Existing Patient Open Opportunities
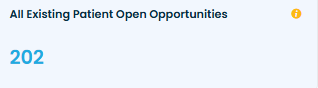
What it means
Open scheduling opportunities for existing patients.
Why it matters
These opportunities often relate to recare, treatment planning, cancellations, or rescheduling needs. Closing them improves retention.
How practices use it
-
Prioritize recare follow-ups
-
Reduce overdue or dormant recall cases
-
Provide better continuity of care
Example
If 202 existing patient opportunities remain open, those patients still need appointments.
All High Value Open Opportunities

What it means
Open opportunities classified as high value (e.g., $$$ services or high revenue potential).
Why it matters
High-value cases directly impact production. Delayed follow-up on these leads to significant revenue loss.
How practices use it
-
Assign senior staff or treatment coordinators
-
Follow up more frequently and proactively
-
Reduce revenue leakage by closing these opportunities quickly
Example
If 65 high-value opportunities remain open, these represent major revenue potential still waiting to be scheduled.
All Hot Open Opportunities

What it means
Open opportunities marked as Hot — typically meaning the patient showed strong intent (e.g., urgent need, flexible schedule, ready to book).
Why it matters
Hot opportunities are the easiest to close. Slow follow-up directly lowers conversion and patient satisfaction.
How practices use it
-
Prioritize these opportunities for same-day callback
-
Assign to the team member with the highest booking success
-
Track hot opportunity closure rate
Example
If 44 hot opportunities are still open, those 44 patients need fast action to convert.
Opportunities Breakdown
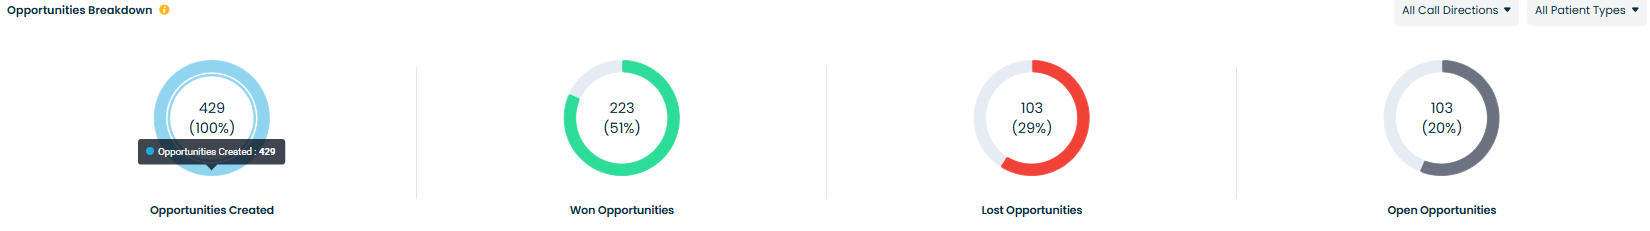
What it means
A visual breakdown showing how all opportunities are distributed across three statuses:
-
Won
-
Lost
-
Open
Why it matters
This provides a quick view of the overall health of your scheduling funnel and highlights whether opportunities are progressing or getting stuck.
How practices use it
-
Identify if too many opportunities remain open
-
Evaluate the ratio of wins to losses
-
Investigate reasons behind spikes in lost opportunities
Example
If the breakdown shows:
-
223 won
-
103 lost
-
103 open
… the practice may focus on reducing the “open” pool through targeted follow-ups.
Opportunity Conversion Trend
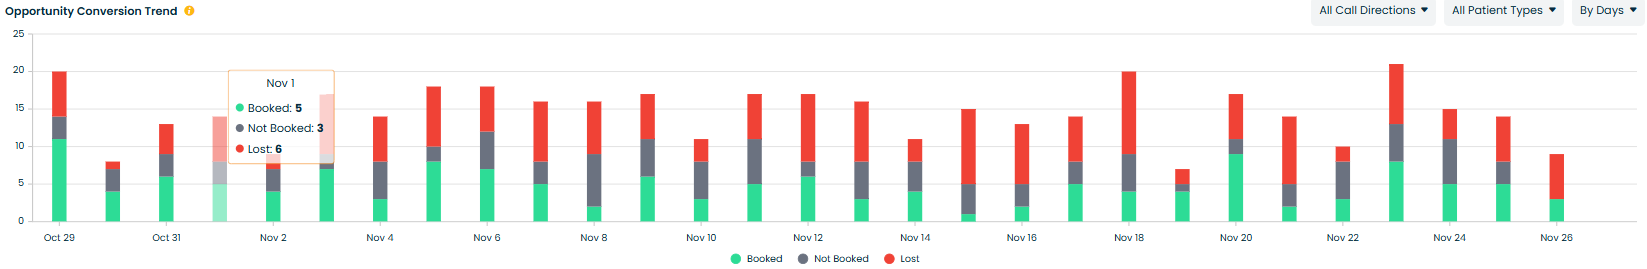
What it means
A daily or weekly trend showing how many patients contacted the practice to book and whether those opportunities were ultimately booked or lost.
Why it matters
Trend data reveals performance patterns — such as staffing gaps, training improvements, or seasonal fluctuations.
How practices use it
-
Monitor daily consistency in booking performance
-
Analyze dips on specific days (staff shortage, high call volume, script issues)
-
Measure progress after coaching or workflow changes
Example
If Thursdays consistently show lower conversion, the manager may assign additional scheduling support on that day.
Opportunity Distribution by User
What it means
This chart lists users (agents/staff) and shows how many scheduling opportunities each person has handled during the selected date range.
Why it matters
It reveals workload distribution and helps identify whether opportunities are being handled centrally, evenly, or concentrated with a few individuals. It also highlights performance capacity and ownership of leads.
How practices use it
-
Balance workloads across staff to avoid burnout and missed follow-ups.
-
Identify top opportunity generators and replicate their techniques.
-
Reassign or train users with low volumes or high drop rates.
-
Validate that opportunities are distributed according to scheduling/shift plans.
Example
If Dr. Grant shows 89 opportunities while Danny shows 12, the manager may investigate whether Danny needs more training, different routing, or a schedule change so he can handle more opportunities.
New Patient Winrate by User
This bar chart shows each user’s conversion performance for new patient opportunities, breaking their activity into Won, Open, and Lost percentages (or counts).
Why it matters
Converting new patients is critical for practice growth. This chart shows which staff members are most effective at turning first-time callers into booked patients.
How practices use it
-
Identify high-performing staff to model best practices.
-
Target coaching for users with low new-patient win rates.
-
Adjust scripts or FAQs for users with high open or lost rates.
-
Set individual goals or incentives for new-patient conversions.
Example
If Bella has an 82%-win rate on new-patient opportunities while Ella has 22%, Bella’s approach can be reviewed and incorporated into team coaching.
Existing Patient Winrate by User
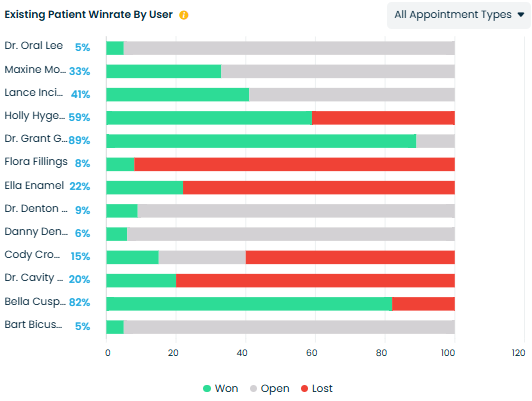
What it means
This chart shows each user’s conversion performance for existing patient opportunities, with Won / Open / Lost breakdowns.
Why it matters
Existing patients should be easier to convert than new patients — low win rates here can signal process or communication problems that affect retention.
How practices use it
-
Spot staff who need coaching on recare/reschedule conversations.
-
Compare handling of existing vs new patients per user to find training gaps.
-
Use results to optimize follow-up cadence and allocate recare responsibilities.
Example
If Dr. Cavity’s existing-patient win rate is 20% while Dr. Grant’s is 89%, review Dr. Cavity’s workflow or scripts for handling return-patient concerns.
Opportunity Created by Appointment Type
What it means
This chart shows how many opportunities were created for each appointment/service type (e.g., Crowns, Root Canals, Invisalign) in the selected time period.
Why it matters
Understanding which services generate the most scheduling interest helps with staffing, treatment coordinator allocation, and forecasting production.
How practices use it
-
Prioritize training and resources for high-volume service lines.
-
Forecast supply needs (e.g., block appointment slots for popular treatments).
-
Align marketing spend with services that generate the most appointment intent.
Example
If Root Canals and Crowns show the highest opportunity counts, the practice might ensure sufficient chair time and treatment coordinator availability for those services.
New Patient Winrate by Appointment Type
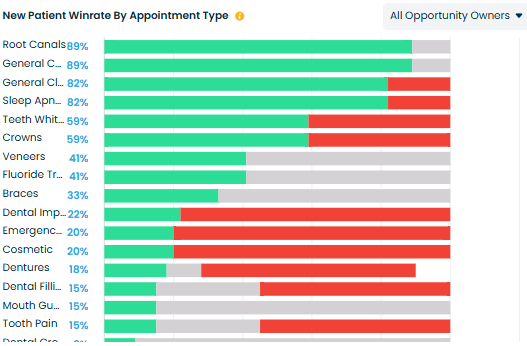
What it means
This chart shows the conversion (Won/Open/Lost) of new-patient opportunities by appointment/service type.
Why it matters
Different services convert at different rates for new patients — this helps identify which services attract new patients who are likely to book and which require additional nurturing.
How practices use it
-
Tailor new-patient messaging for services with low conversion.
-
Create service-specific scripts for new-patient inquiries.
-
Adjust marketing and landing pages to reflect services that convert well for first-time callers.
Example
If Cosmetic procedures show low new patient win rates but Veneers show high win rates, the marketing and booking flow for Cosmetic should be reviewed to improve conversion.
Existing Patient Winrate by Appointment Type
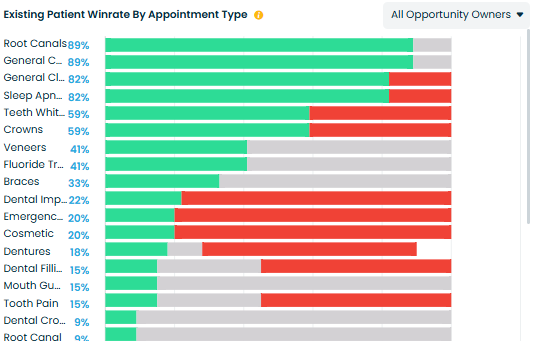
What it means
This chart shows the conversion breakdown (Won/Open/Lost) of existing-patient opportunities categorized by appointment/service type.
Why it matters
It highlights which services existing patients are likely to accept and which encounter resistance — useful for retention and recare strategies.
How practices use it
-
Focus recare campaigns on services with high acceptance among existing patients.
-
Investigate friction for services with high lost rates (scheduling constraints, pricing, prep requirements).
-
Reassign staff or tweak follow-up processes for service types with poor conversion for existing patients.
Example
If Recare and Routine Check services show high win rates among existing patients, the practice can scale automated reminders and recare outreach for those services.
New Patient Opportunities Lost by Reason
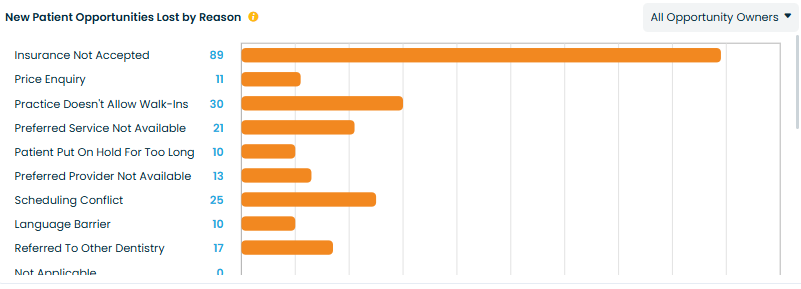
What it means
A breakdown showing why new patient opportunities were lost (e.g., price concerns, insurance not accepted, lack of availability, patient not ready, etc.).
Why it matters
Understanding the obstacles new patients face helps the practice improve onboarding, scheduling, and marketing messaging.
How practices use it
-
Identify which objections occur most frequently
-
Improve scripts to address high-impact objections
-
Refine marketing to match patient expectations
-
Align availability (e.g., more new-patient slots if lack-of-availability is high)
Example
If 25% of new patient losses are due to “Preferred Slot Not Available” the practice may consider adding blocks for new-patient emergencies.
Existing Patient Opportunities Lost by Reason
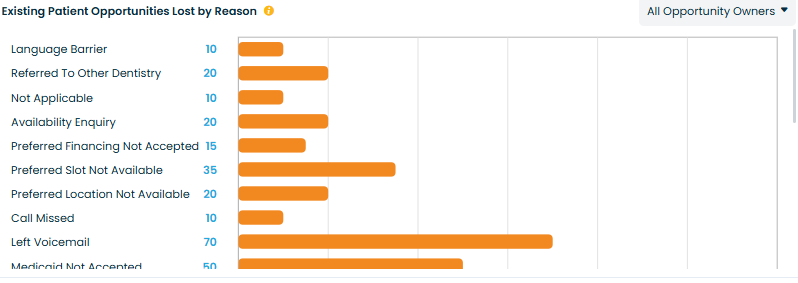
What it means
A breakdown showing why existing patient opportunities were lost (e.g., scheduling conflicts, cost concerns, treatment deferred, missed follow-ups).
Why it matters
Losses here reflect retention risks — existing patients are easier and more cost-effective to convert.
How practices use it
-
Identify friction points in rescheduling, recare, or treatment acceptance
-
Redesign follow-up workflows for existing patients
-
Reduce churn by addressing common objections
Example
If many losses happen because “Call Back Later” the team may adopt a proactive recall or follow-up strategy.
Related Articles
Opportunities Overview - Adit Call Intelligence
Overview The Opportunities Dashboard in Adit Call Intelligence helps your practice track every booking opportunity — whether it comes from new patients calling for the first time or existing patients reaching out for appointments. It shows how many ...AI Intelligence Overview - Adit Call Intelligence
AI Intelligence provides a complete, data-driven view of your practice’s performance across calls, opportunities, call handling, task management, and location-level metrics. This article gives a high-level overview of each dashboard before you ...AI Intelligence — Calls Analytics Overview
The Call Analytics page provides a comprehensive view of phone performance across your practice. It aggregates volumes, directions, missed-call recovery, scheduling performance, and marketing source attribution. Use these charts and KPIs to optimize ...AI Intelligence - Location Analytics
The Location Analytics module provides a comparative view of call performance, opportunities, sentiment, and task execution across all locations in your organization. It allows multi-location practices to understand which offices perform strongly, ...AI Coaching - Adit Call Intelligence
Overview AI Coaching in Adit Call Intelligence provides a complete view of how your front desk is performing on patient calls. It analyzes scored conversations, tracks coaching opportunities, highlights unhappy customer trends, and shows how ...